
The Short Answer: Network telemetry is the automated collection and streaming of performance and health data from network devices in real time. Instead of waiting to discover problems after they affect customers, telemetry gives your team continuous visibility into what’s happening across your network infrastructure.
For telecom and broadband operators, the need is straightforward. Networks are getting larger, more complex, and harder to monitor manually. Legacy tools like Simple Network Management Protocol (SNMP) were built for a different era. They poll devices on a schedule, which means you only see snapshots of what happened between intervals. Telemetry flips that model. Network devices push telemetry data as conditions change, giving network operators a live feed of performance metrics, device status, and traffic patterns.
This post covers what network telemetry is, what you can monitor with it, and what to look for in a telemetry platform that fits your operation.
What is Network Telemetry?
Network telemetry is a data collection method where network devices automatically stream health and performance information to a central telemetry platform. Rather than a management system asking each device for an update on a schedule, the devices themselves push data as it changes.
How It Differs from Legacy Monitoring
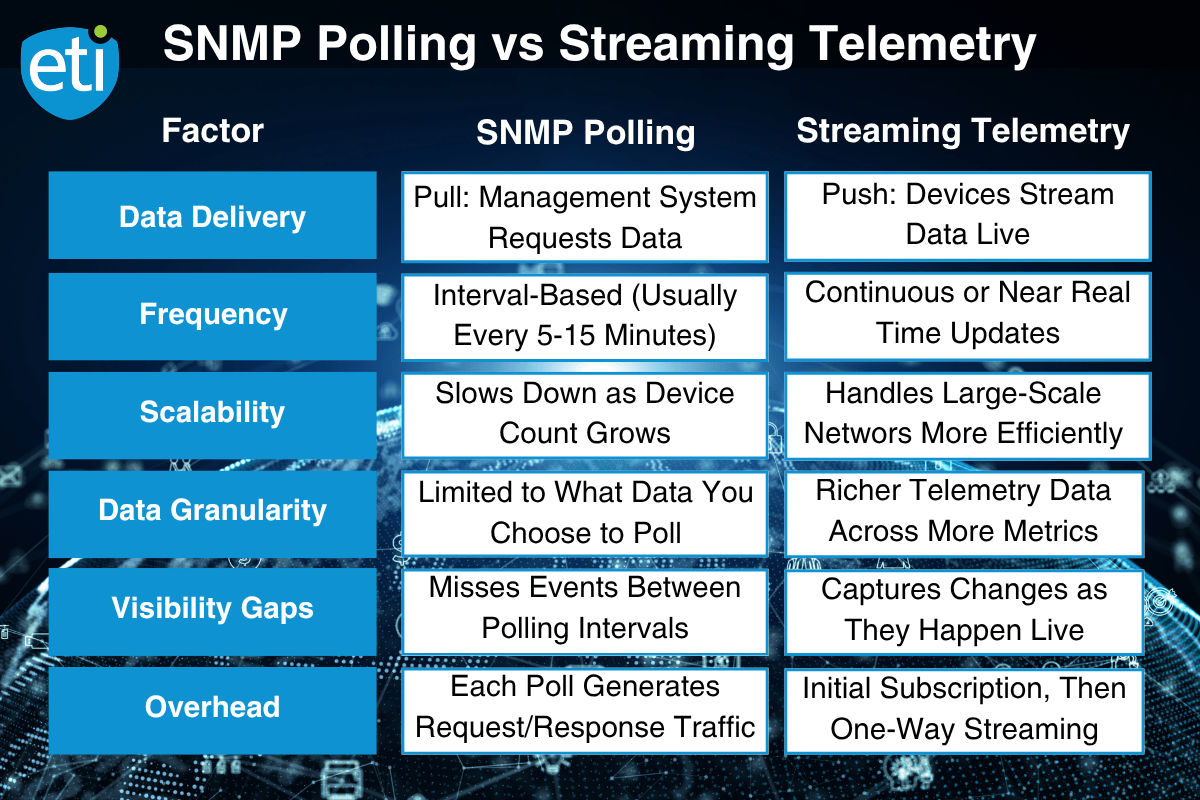
SNMP, the standard for decades, works on a poll-and-response model. Your management plane sends a request, the device responds, and you get a point-in-time snapshot. That works fine with a small number of devices and slow-moving network conditions. It doesn’t hold up when you’re managing thousands of endpoints across a growing network infrastructure.
How Streaming Telemetry Works
Streaming telemetry delivers data continuously. Network devices report on metrics like packet loss, CPU utilization, interface errors, network traffic volume, and forwarding performance without waiting to be asked. The result is a real-time picture of your network instead of a series of snapshots stitched together after the fact.
SNMP Polling vs. Streaming Telemetry
 Telemetry protocols and network telemetry frameworks standardize how this data gets structured and delivered across different device types and vendors. Your collected data arrives in a consistent format regardless of the data source, making it easier to process, correlate, and act on.
What You Can Monitor with Telemetry
Network telemetry covers a wide range of metrics across both network performance and device health. Here’s where it has the most impact for operators.
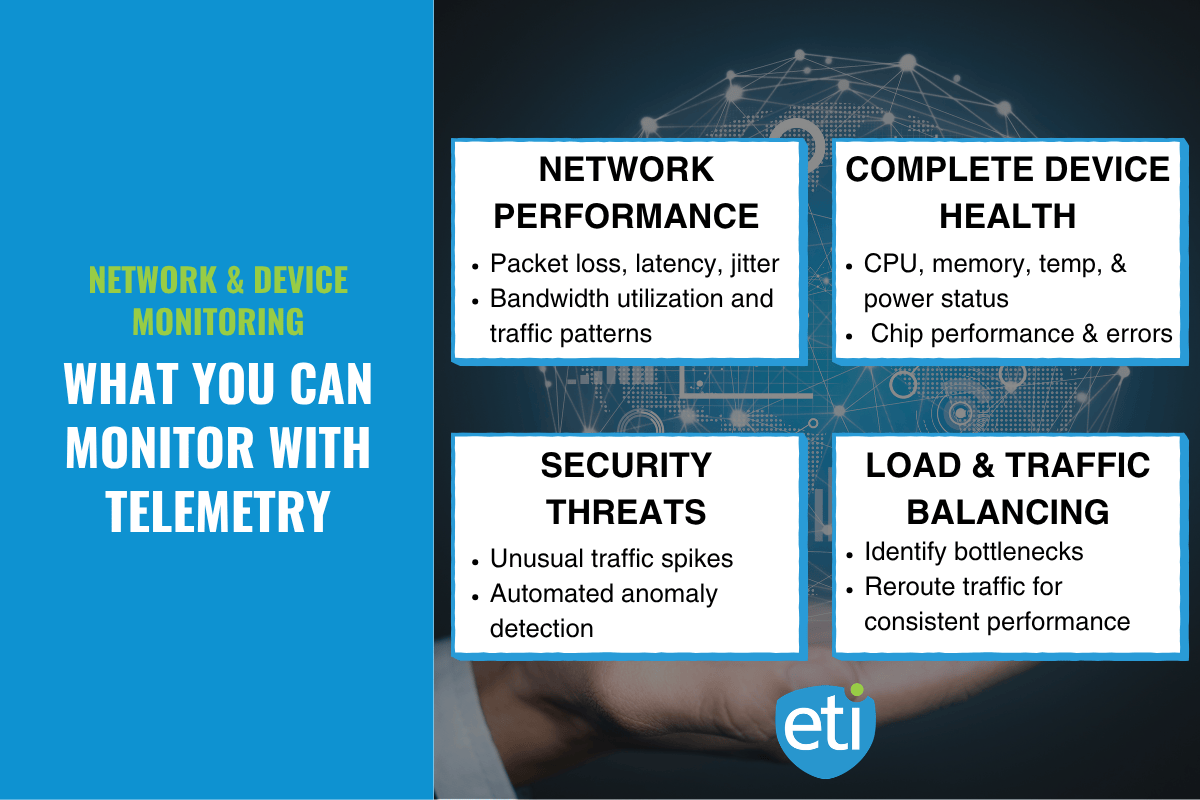
Network Performance
Telemetry gives your team real-time visibility into how traffic moves across your network. Key metrics include packet loss, latency, jitter, throughput, and bandwidth utilization. When these start trending in the wrong direction, telemetry surfaces the issue before it becomes a customer-facing problem.
For network operators managing IP networks across multiple segments, this level of network insight makes capacity planning and traffic engineering more precise. You’re working from live data, not last week’s report.
Device Health
Every network device generates data about its own condition. Telemetry captures CPU and memory usage, temperature, power status, and forwarding chip performance. When a device starts showing signs of stress, your team knows about it in real time rather than discovering it during a scheduled maintenance window.
Security Threats and Anomaly Detection
Telemetry data feeds directly into anomaly detection workflows. Unusual spikes in network traffic, unexpected changes in IP addresses, or abnormal device behavior can signal security threats. Machine learning models trained on baseline telemetry data can flag these patterns automatically, giving your team a head start on investigation.
Load Balancing and Traffic Distribution
Monitoring how traffic distributes across your network helps identify bottlenecks and underutilized paths. Telemetry provides the real-time insights your team needs to adjust load balancing, reroute traffic, and maintain consistent forwarding performance across the network.
Broader Applications
The same telemetry principles apply beyond traditional telecom. Service providers managing hybrid cloud environments, software defined networking deployments, and smart city infrastructure all rely on telemetry solutions to maintain visibility across distributed systems.
What to Look for in a Telemetry Platform
Not all telemetry solutions are built the same. The right telemetry platform should fit your current operation and scale with it. Here’s what matters most for network operators.
Real-Time Data Collection Across Multiple Data Sources
Your platform needs to ingest telemetry data from every network device in your environment, regardless of vendor or device type. That includes ONTs, OLTs, routers, switches, and any CPE you manage. If your telemetry platform only covers part of your network, you’re still left with blind spots.
Integration with Existing Systems
Telemetry data is most valuable when it connects to the systems your team already uses. Look for a platform that integrates with your network management tools, OSS/BSS, and any GIS or mapping environments you rely on. The goal is actionable insights flowing into existing workflows, not another standalone dashboard your team has to check separately.
Scalability for Growing Infrastructure
As your network grows, your telemetry system needs to keep up. More devices means more data. A platform that handles a few hundred endpoints today but can’t scale to thousands will become a bottleneck. Cloud computing and distributed processing architectures help here, especially for large enterprise and service provider environments.
Actionable Insights, Not Just Data
Raw telemetry data on its own isn’t useful. Your platform should turn collected data into alerts, trends, and recommendations your team can act on. That means built-in anomaly detection, threshold-based alerting, and the ability to correlate data across multiple network devices to pinpoint root causes faster.
Geographic Visibility
For operators managing distributed infrastructure, seeing device health and network performance on a map adds a layer of context that tables and charts can’t match. ETI’s Intelegrate platform integrates with Esri’s ArcGIS to display real-time device telemetry geographically, helping NOC teams pinpoint outages and performance issues faster. See how ETI and Esri work together.
How ETI Helps
ETI’s Intelegrate platform is built to deliver on each of these areas for telecom and broadband providers. Intelegrate Observe collects real-time, vendor-agnostic telemetry from network devices and normalizes it into a single operational view. Intelegrate Connect integrates that telemetry data with your existing OSS, BSS, and network management systems so insights flow into the workflows your team already uses. Intelegrate Automate closes the loop by turning those insights into action, triggering automated provisioning, service activation, and corrective workflows without manual intervention.
The platform scales from a few thousand devices to millions and supports cloud-native, on-prem, and hybrid deployments. See how it works.
Where to Start
Network telemetry gives your team the real-time visibility needed to move from reactive troubleshooting to proactive network management. Instead of waiting for customers to report problems, your systems surface issues as they happen.
The foundation is straightforward: streaming telemetry data from your network devices, integrating it with the systems your team already uses, and turning that data into actionable insights that drive faster decisions. The operational payoff shows up in less downtime, faster issue resolution, and better capacity planning across your network.
Start by identifying where your current monitoring has gaps. If you’re still relying on polling-based tools that only show you snapshots between intervals, that’s where telemetry makes the biggest immediate difference.
Want to see how this fits your environment? Contact ETI to walk through your network monitoring and telemetry needs.