
The Short Answer: Broadband operators collect massive amounts of data from their network devices, but most of it sits in disconnected tools that only show part of the picture. Centralized device monitoring brings all of that data into one dashboard, giving your team full visibility into device health, network performance, and subscriber impact in real time.
For most operators, the data isn’t the problem. You already have devices reporting status, performance metrics, and error logs across your network. The problem is where that data ends up. One vendor portal shows your optical network terminals. A separate tool monitors your switches. A legacy platform covers part of your core network. Your team is always bouncing between them, trying to piece together what’s happening.
Centralized monitoring changes that by pulling device data from across your entire network infrastructure into a single view your team can actually use. Instead of checking four tools to troubleshoot one issue, your team starts with the full picture and works from there.
The Problem with Scattered Device Data
Too Many Tools, No Single View
Most broadband operators didn’t set out to build a fragmented monitoring environment. It happened over time. One vendor’s equipment came with its own management portal. A legacy monitoring tool stayed in place because it still covered part of the network. The NOC (Network Operations Center) team added another tool when the network expanded. Each one made sense on its own when added.
The result is a patchwork of platforms that each show a slice of the network but none show the whole thing. Your team has to log into multiple systems just to troubleshoot a basic issue. That time adds up fast.
What Gets Missed
When device data is scattered across separate systems, things fall through the cracks.
- Performance issues develop gradually on a device type that one tool doesn’t monitor closely
- A new device gets added to the network but doesn’t get picked up by existing monitoring
- Historical data lives in one platform while real-time alerts come from another, making trend analysis difficult
- Network traffic spikes on a segment nobody is actively watching because it’s between tools
- Security threats like unauthorized access go undetected because no single system has complete visibility across all connected devices
The longer these gaps exist, the more your team relies on subscriber complaints as the early warning system instead of catching problems before they reach the customer.
What Centralized Device Monitoring Looks Like
One Dashboard Across All Devices
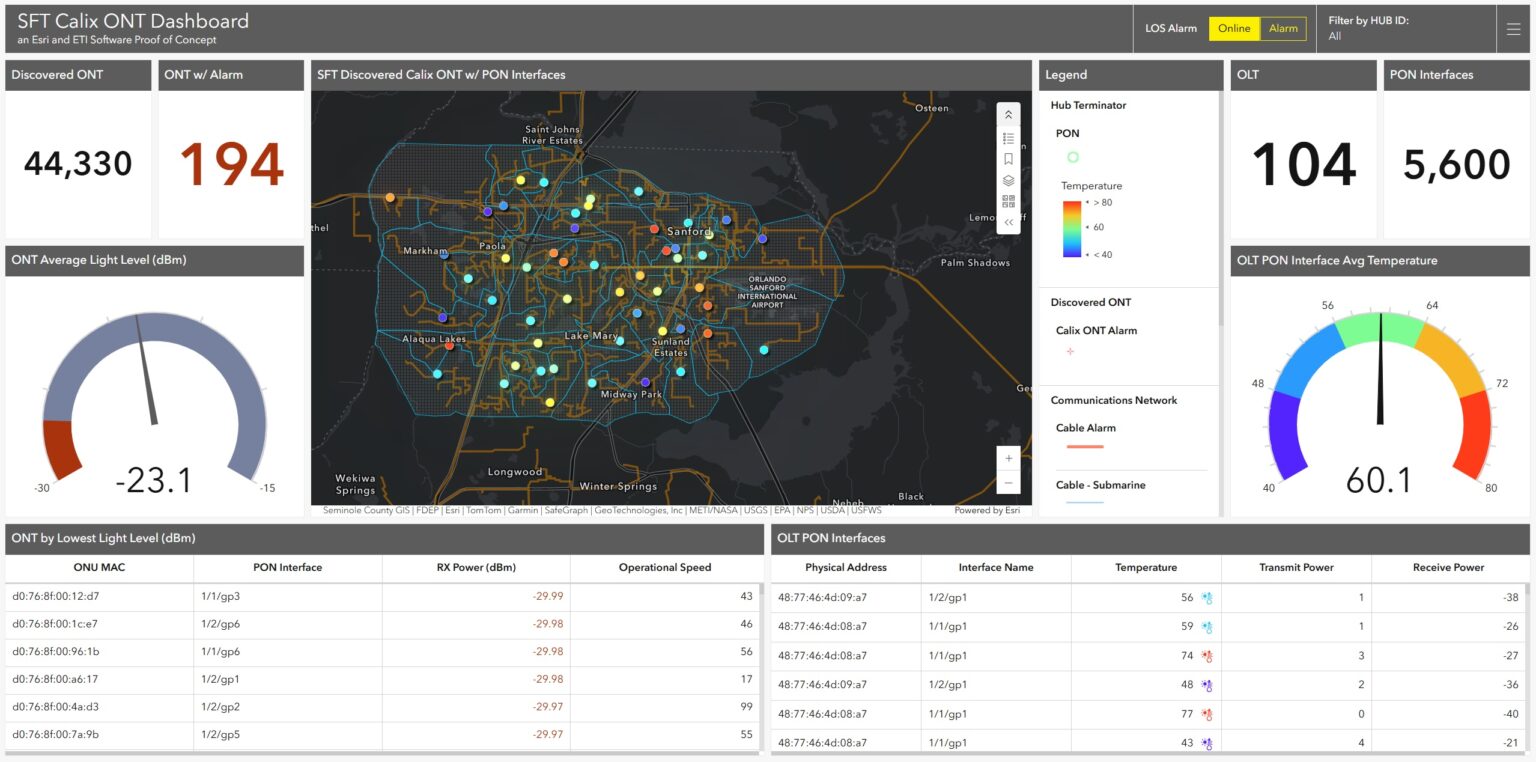
Centralized monitoring means every connected device on your network reports into a single platform, regardless of vendor or device type. Routers, switches, optical network terminals, access points, and customer premises equipment all show up in one view.
Your team shouldn’t need to know which vendor made a device to find its status. A centralized platform normalizes data across manufacturers so everything appears in a consistent format. ETI’s Intelegrate Observe does exactly this, pulling telemetry from devices across vendors and presenting it in one operational dashboard.
Key Metrics at a Glance
A good dashboard surfaces the information your team needs without forcing them to dig for it:
- Device health status across the full network infrastructure
- Bandwidth usage and network traffic patterns per device or segment
- Device configuration status and firmware versions
- Performance metrics like signal levels, error rates, and uptime
- Real-time alerts when a monitored device crosses a threshold
From Raw Data to Actionable Views
Every device on your network generates raw data: IP addresses, SNMP credentials, traffic flow logs, configuration files, telemetry streams, and more. On their own, these are just numbers. Centralized monitoring turns them into views your team can use to spot patterns, compare performance across device types, and address issues before they affect subscribers.
That means dashboards built around how your team actually works, not just how the data is structured. A NOC engineer troubleshooting a subscriber issue needs a different view than a network planner evaluating capacity across a market.
What You Gain from Centralized Monitoring
Faster Root Cause Analysis
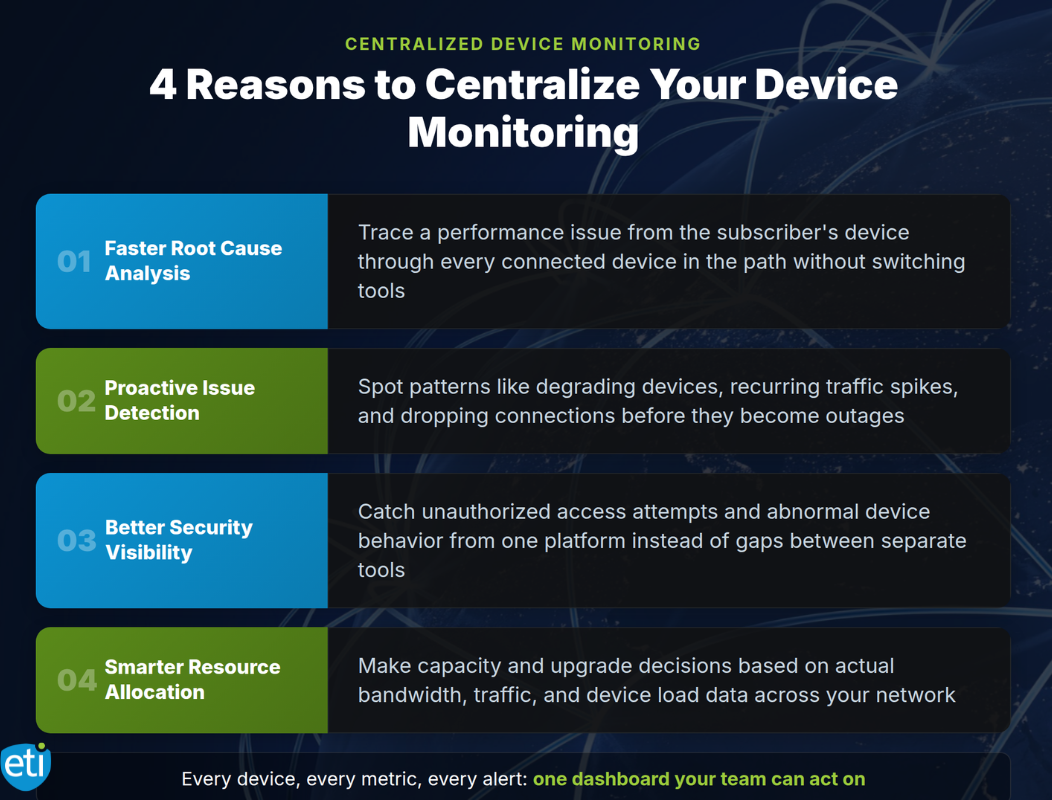
When all of your device data lives in one place, your team can trace a performance issue from the subscriber’s device through every connected device in the path without switching tools, cutting troubleshooting time from an hour to a few minutes.
Proactive Issue Detection
When your platform tracks performance metrics across every device continuously, patterns that would be invisible across scattered tools become obvious: a device type degrading across a market, a router spiking at the same time every evening, or an access point dropping connections under specific traffic patterns.
Better Security Visibility
Unauthorized access attempts, unusual traffic patterns, and abnormal device behavior are easier to catch when your team has complete visibility across the network from a single platform instead of gaps between separate tools.
Smarter Resource Allocation
Real data on bandwidth usage, traffic flow, and device load means your team makes capacity and upgrade decisions based on actual performance data, not guesswork or whoever complains the loudest.
Building Your Centralized Dashboard with ETI
Device Discovery and Inventory
You can’t monitor what you can’t see. The first step is scanning your full network infrastructure to find every connected device, including ones that may have been added without going through a formal onboarding process. Most operators are surprised by how many unmonitored or unknown devices are sitting on their network. Getting a complete inventory is the foundation everything else builds on.
Vendor-Agnostic Monitoring with Intelegrate Observe
Different device types from different vendors report data differently. Field names don’t match. Metrics are formatted inconsistently. Some devices support Simple Network Management Protocol (SNMP), others use streaming telemetry, and some older equipment requires manual polling.
Intelegrate Observe handles this normalization automatically. It pulls telemetry from devices across vendors and presents it in one consistent, operational view. Your team sees the same format no matter what manufacturer they’re looking at.
What Comes Next: Connect and Automate
Once your team has centralized visibility through Intelegrate Observe, the next step is putting that data to work across the rest of your operation.
Intelegrate Connect ties your monitoring data to your ticketing system, field service tools, and OSS so the insights on your dashboard turn into action. A device flagged as failing can trigger a ticket, populate it with the right device details, and route it to the right team without someone copying and pasting between systems.
From there, Intelegrate Automate takes it a step further by executing corrective actions automatically for known issues, reducing the need for manual intervention or a truck roll.
For operators managing distributed infrastructure, ETI’s integration with Esri’s ArcGIS also lets your team view device health and performance geographically on a live map.
From Scattered Data to a Single View
Broadband operators don’t lack device data. They lack a clean way to see it all in one place. When monitoring is spread across vendor portals, legacy tools, and disconnected platforms, your team spends more time searching for information than acting on it.
Centralized device monitoring fixes that by bringing every device, every metric, and every alert into one dashboard. Your team catches issues faster, traces problems to their root cause in minutes instead of hours, and makes smarter decisions about where to invest network resources.
Want to see how this fits your network? Contact ETI to walk through your device monitoring and integration needs.