
The Short Answer: Mean time to repair (MTTR) measures how long it takes your team to restore service after an incident. Network telemetry reduces MTTR by giving operators real-time visibility into network and device health, so teams spend less time finding the problem and more time fixing it.
For telecom and broadband operators, every minute of downtime counts. When something breaks, the clock starts. The longer it takes to detect the issue, identify the root cause, and restore normal operation, the more it costs in customer satisfaction, lost revenue, and operational efficiency.
The challenge with legacy monitoring is that most of that time gets burned before the repair process even begins. Teams waste cycles chasing symptoms, sorting through false positives, and piecing together data from disconnected tools. Telemetry changes that equation by streaming real-time data from network devices the moment conditions change, giving your team the context they need to act faster.
What is MTTR and Why Does It Matter?
How MTTR is Calculated
MTTR stands for mean time to repair. It’s the average time it takes to restore a system or service after an incident, measured from the moment the issue is detected to the moment normal operation resumes.
The MTTR calculation is straightforward: take the total time spent on repairs across all incidents in a given period, then divide by the number of incidents. If your team handled 10 outages last month and spent a combined 20 hours resolving them, your MTTR is 2 hours.
It’s a key metric because it captures the full repair process, not just how fast someone responds, but how fast the issue actually gets resolved.
What High MTTR Costs You
A high MTTR hits the business from multiple angles. Customers experience longer outages, which drives up complaints and churn. Your support team spends more time in incident response mode, pulling them away from strategic initiatives and proactive monitoring. And every extra minute of downtime adds to financial losses, especially for service providers with SLA commitments.
| High MTTR | Low MTTR | |
| Customer experience | Longer outages, more complaints, higher churn | Shorter disruptions, fewer escalations |
| Operational cost | More labor hours per incident, overtime, emergency fixes | Faster resolution, fewer resources per incident |
| Team focus | Stuck in reactive firefighting mode | Freed up for preventive measures and improvement |
| Revenue impact | SLA penalties, lost revenue during downtime | Protected revenue, stronger retention |
Reducing MTTR isn’t just about fixing things faster. It’s about protecting revenue, improving customer satisfaction, and giving your team room to focus on the work that moves the business forward.
Why Traditional Monitoring Leads to Longer MTTR
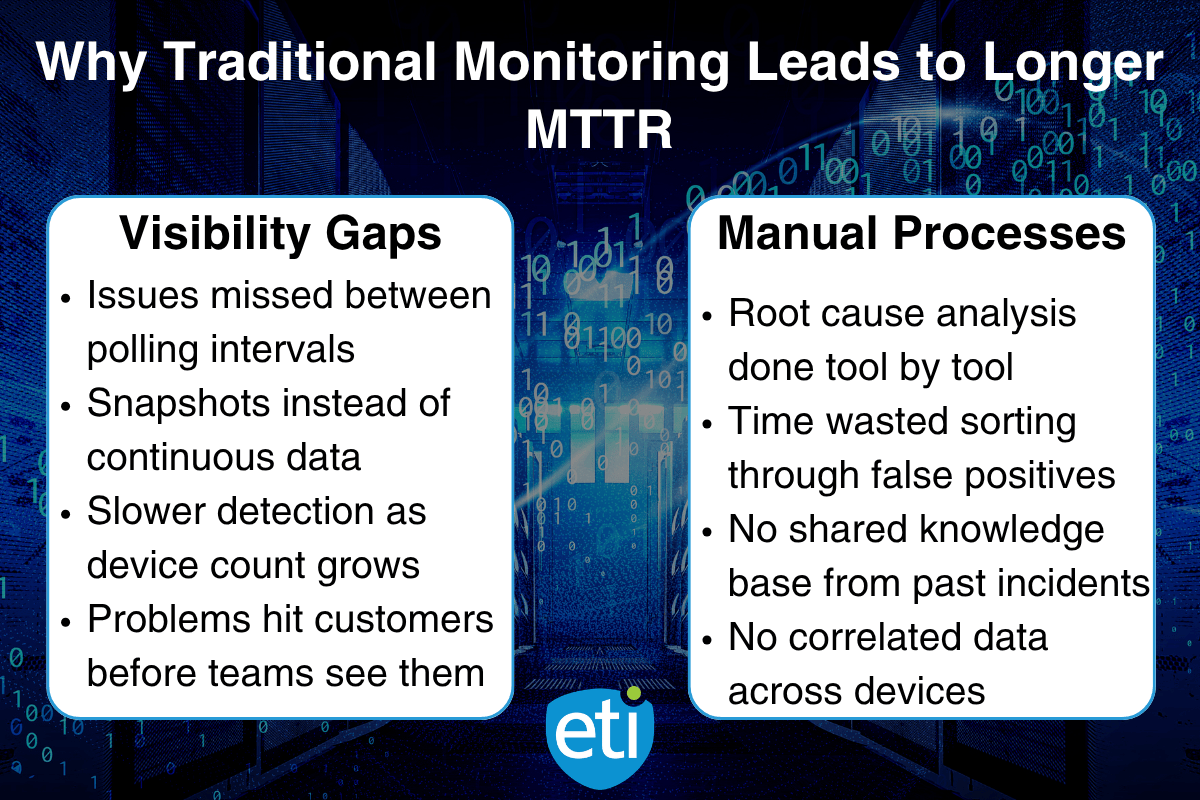
Visibility Gaps
Most legacy monitoring tools rely on polling. Your management system sends a request to each network device on a set interval, and the device responds with a snapshot of its current state. The problem is what happens between those intervals.
If an issue occurs and resolves before the next poll, your team never sees it. If an issue starts building gradually, the snapshots may not show enough change to trigger an alert until the problem is already affecting customers. By the time incident detection happens, your team is already behind.
For operators managing large or growing network infrastructure, these gaps compound. More devices means more polling traffic, slower cycles, and a wider window for problems to go unnoticed.
Manual Processes
Even after an issue is detected, traditional monitoring often leaves teams without enough context to act quickly. Without correlated data across devices and systems, the support team has to manually piece together what happened, where, and why.
That means logging into multiple tools, comparing timestamps, and ruling out false positives before the real root cause analysis even starts. When similar incidents come up again weeks later, teams frequently start from scratch because there’s no shared knowledge base connecting past incidents to current ones.
Each of these manual steps adds time. And in an MTTR calculation, every minute spent searching for the problem is a minute the customer is still waiting.
How Network Telemetry Shortens Each Phase of MTTR
MTTR isn’t one big block of time. It breaks down into phases: detection, identification, resolution, and recovery. Telemetry improves each one.
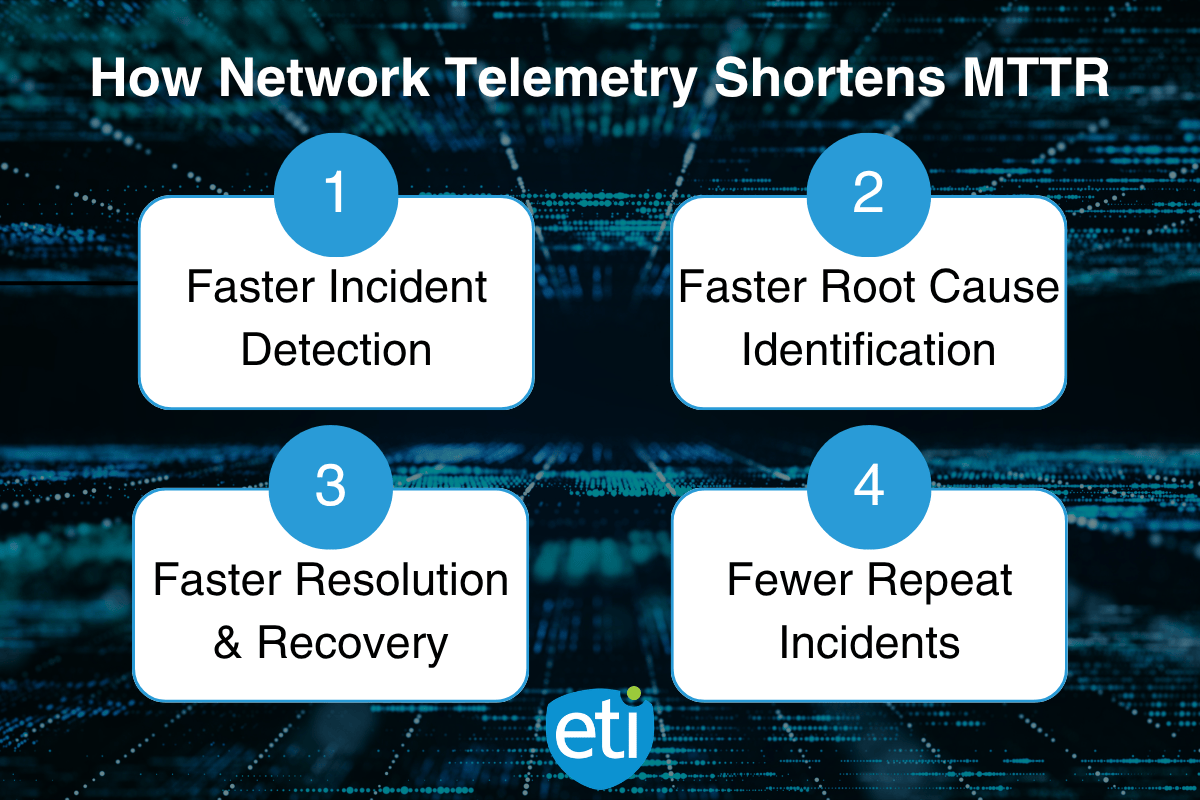
Faster Incident Detection
With streaming telemetry, network devices push data continuously rather than waiting to be polled. The moment a metric crosses a threshold, whether that’s a spike in packet loss, a drop in throughput, or an interface going down, your telemetry platform surfaces it in real time.
That eliminates the gap between when an incident starts and when your team knows about it. Incident detection goes from minutes (or longer) to seconds, which immediately reduces the front end of your resolution time.
Faster Root Cause Identification
Detection is only half the battle. Knowing something is wrong and knowing why are two different things.
Telemetry provides correlated data across multiple devices, interfaces, and network layers. Instead of checking systems one at a time, your team sees the full picture: which device, which port, which metric changed, and what else was affected at the same time. That context turns root cause analysis from a manual investigation into a guided process.
Observability tools built on telemetry data can also surface patterns that point directly to the source, reducing the time your team spends ruling out false positives and chasing symptoms.
Faster Resolution and Recovery
When your team starts the repair process with context instead of guesswork, resolution happens faster. They know what broke, where it broke, and what’s affected, so they can take the right response actions the first time.
Telemetry also supports automated recovery workflows. If a known condition triggers a predefined response, the system can act without manual intervention, restoring normal operation before a technician even picks up the ticket. That’s the difference between a 45-minute outage and one that’s resolved in under five.
Fewer Repeat Incidents
Every incident your telemetry platform captures becomes part of a growing knowledge base. Over time, patterns emerge. Your team starts recognizing the early signals behind recurring issues and can put preventive measures in place before they cause another outage.
This is where telemetry shifts from reactive to proactive. Instead of waiting for similar incidents to happen again, your team uses historical telemetry data to identify potential issues and address them during planned maintenance windows.
From Reactive to Proactive
Predictive Monitoring
Reducing MTTR is a measurable win, but telemetry’s real value goes further. When you layer artificial intelligence and machine learning on top of continuous telemetry data, your team moves from responding to incidents to predicting them.
Anomaly detection models learn what normal looks like across your network devices and flag deviations before they escalate into outages. A device running hotter than its baseline, a gradual increase in error rates on a specific interface, or an unusual shift in network traffic patterns can all trigger an alert days before a failure happens. That’s proactive monitoring in practice, not just watching dashboards, but having your platform do the watching for you.
Freeing Your Team
When your team spends less time on incident response and manual troubleshooting, they get time back for the work that improves the business. That means focusing on continuous improvement, capacity planning, and strategic initiatives instead of fighting the same fires on repeat.
Lower MTTR also reduces the operational strain on your support team. Fewer escalations, fewer late-night calls, and fewer incidents where multiple people are pulled in to troubleshoot a single issue. Over time, that adds up to better operational efficiency and a team that can focus on building a stronger network instead of patching the current one.
ETI’s Intelegrate Observe platform gives telecom operators the real-time telemetry foundation to make this shift. Combined with Intelegrate Connect for system integration and Intelegrate Automate for automated response workflows, operators can reduce MTTR across the board while building toward predictive, proactive network operations. Schedule a demo to learn how it can improve your systems today!
Where to Start
MTTR is one of the clearest indicators of how well your network operations are performing. When it’s high, your team is spending too much time finding problems and not enough time fixing them. When it’s low, customers stay connected, revenue stays protected, and your team stays focused on the right work.
Network telemetry attacks MTTR at every phase. Faster detection, faster root cause identification, faster resolution, and fewer repeat incidents. The shift from polling-based snapshots to real-time streaming data gives your team the visibility and context they need to act in seconds instead of hours.
You don’t need to overhaul your entire monitoring stack to start improving. Identify the incident types that take the longest to resolve today and focus your telemetry efforts there first. The gains compound quickly.
Want to see how this fits your environment? Contact ETI to walk through your network monitoring and telemetry needs.
Frequently Asked Questions